EPA AQS Analysis (January 1-30, 2025)
Data Acquisition
Data Source
- API: EPA AQS Data API (https://aqs.epa.gov/data/api)
- Endpoint:
/dailyData/byCounty - Parameter Code: 88101 (PM2.5 FRM/FEM Mass)
- Authentication: Email-based API key system
Data Characteristics
- Total Monitoring Sites: 10 official EPA stations
- Geographic Coverage:
- Salt Lake County: 9 stations
- Davis County: 1 station (Bountiful Viewmont)
- Temporal Resolution: Daily 24-hour averages
- Analysis Period: January 1-30, 2025
- Records in Analysis Period: 4,880 measurements
- Full Dataset Available: 57,639 records (January 1 - December 31, 2025)
Monitoring Stations
- Bountiful Viewmont (Site 4) - Davis County
- Copper View (Site 2005) - Salt Lake County
- Hawthorne (Site 3006) - Salt Lake County
- ROSE PARK (Site 3010) - Salt Lake County
- Herriman #3 (Site 3013) - Salt Lake County
- Lake Park (Site 3014) - Salt Lake County
- Utah Technical Center (Site 3015) - Salt Lake County
- Inland Port (Site 3016) - Salt Lake County
- Red Butte (Site 3018) - Salt Lake County
- Near Road (Site 4002) - Salt Lake County
Data Quality
- Measurement Method: FRM/FEM (Federal Reference/Equivalent Method)
- Quality Assurance: EPA-certified, regulatory-grade instruments
- PM2.5 Range (Jan 1-30, 2025): 0.30 - 30.24 µg/m³
- Mean PM2.5: 7.36 µg/m³
- Median PM2.5: 5.40 µg/m³
- Air Quality Status: 82.4% “Good” (<12 µg/m³), 17.6% “Moderate” (12-35 µg/m³), 0% “Unhealthy” (>35 µg/m³)
Advantages
- Regulatory-grade accuracy and precision
- Official data accepted for compliance reporting
- Long-term historical records available
- Consistent measurement methodology
Limitations
- Low spatial density (10 sites for entire study area)
- Data availability lag (2-4 weeks after collection)
- Insufficient for neighborhood-level interpolation with heatmap visualization
Technical Methodology
Coordinate System Standardization
- Target CRS: Web Mercator (EPSG:3857)
- Rationale: Standard web mapping projection ensures accurate overlay on basemaps and compatibility with web visualization libraries
- Reprojection: All spatial data (census tracts, monitoring station locations) converted from WGS84 (EPSG:4326) to EPSG:3857
Data Processing
- Temporal Aggregation: Daily 24-hour average PM2.5 values aggregated by monitoring station
- Statistical Method: Mean PM2.5 calculated across all dates in the analysis period (January 1-30, 2025)
- Result: One representative PM2.5 value per monitoring station for point-based visualization
- Rationale: Provides single representative value per station that captures the overall air quality pattern during the analysis period
Visualization Approach
- Method: Point-based visualization with monitoring stations as discrete locations
- Color Coding: Stations color-coded by PM2.5 value using YlOrRd colormap
- Demographic Context: Overlaid on census tract choropleth showing population distribution (separate maps for 65+ and 85+)
- Output: High-resolution static maps (300 DPI) and interactive web maps for both age groups
Deliverables
Static Visualizations
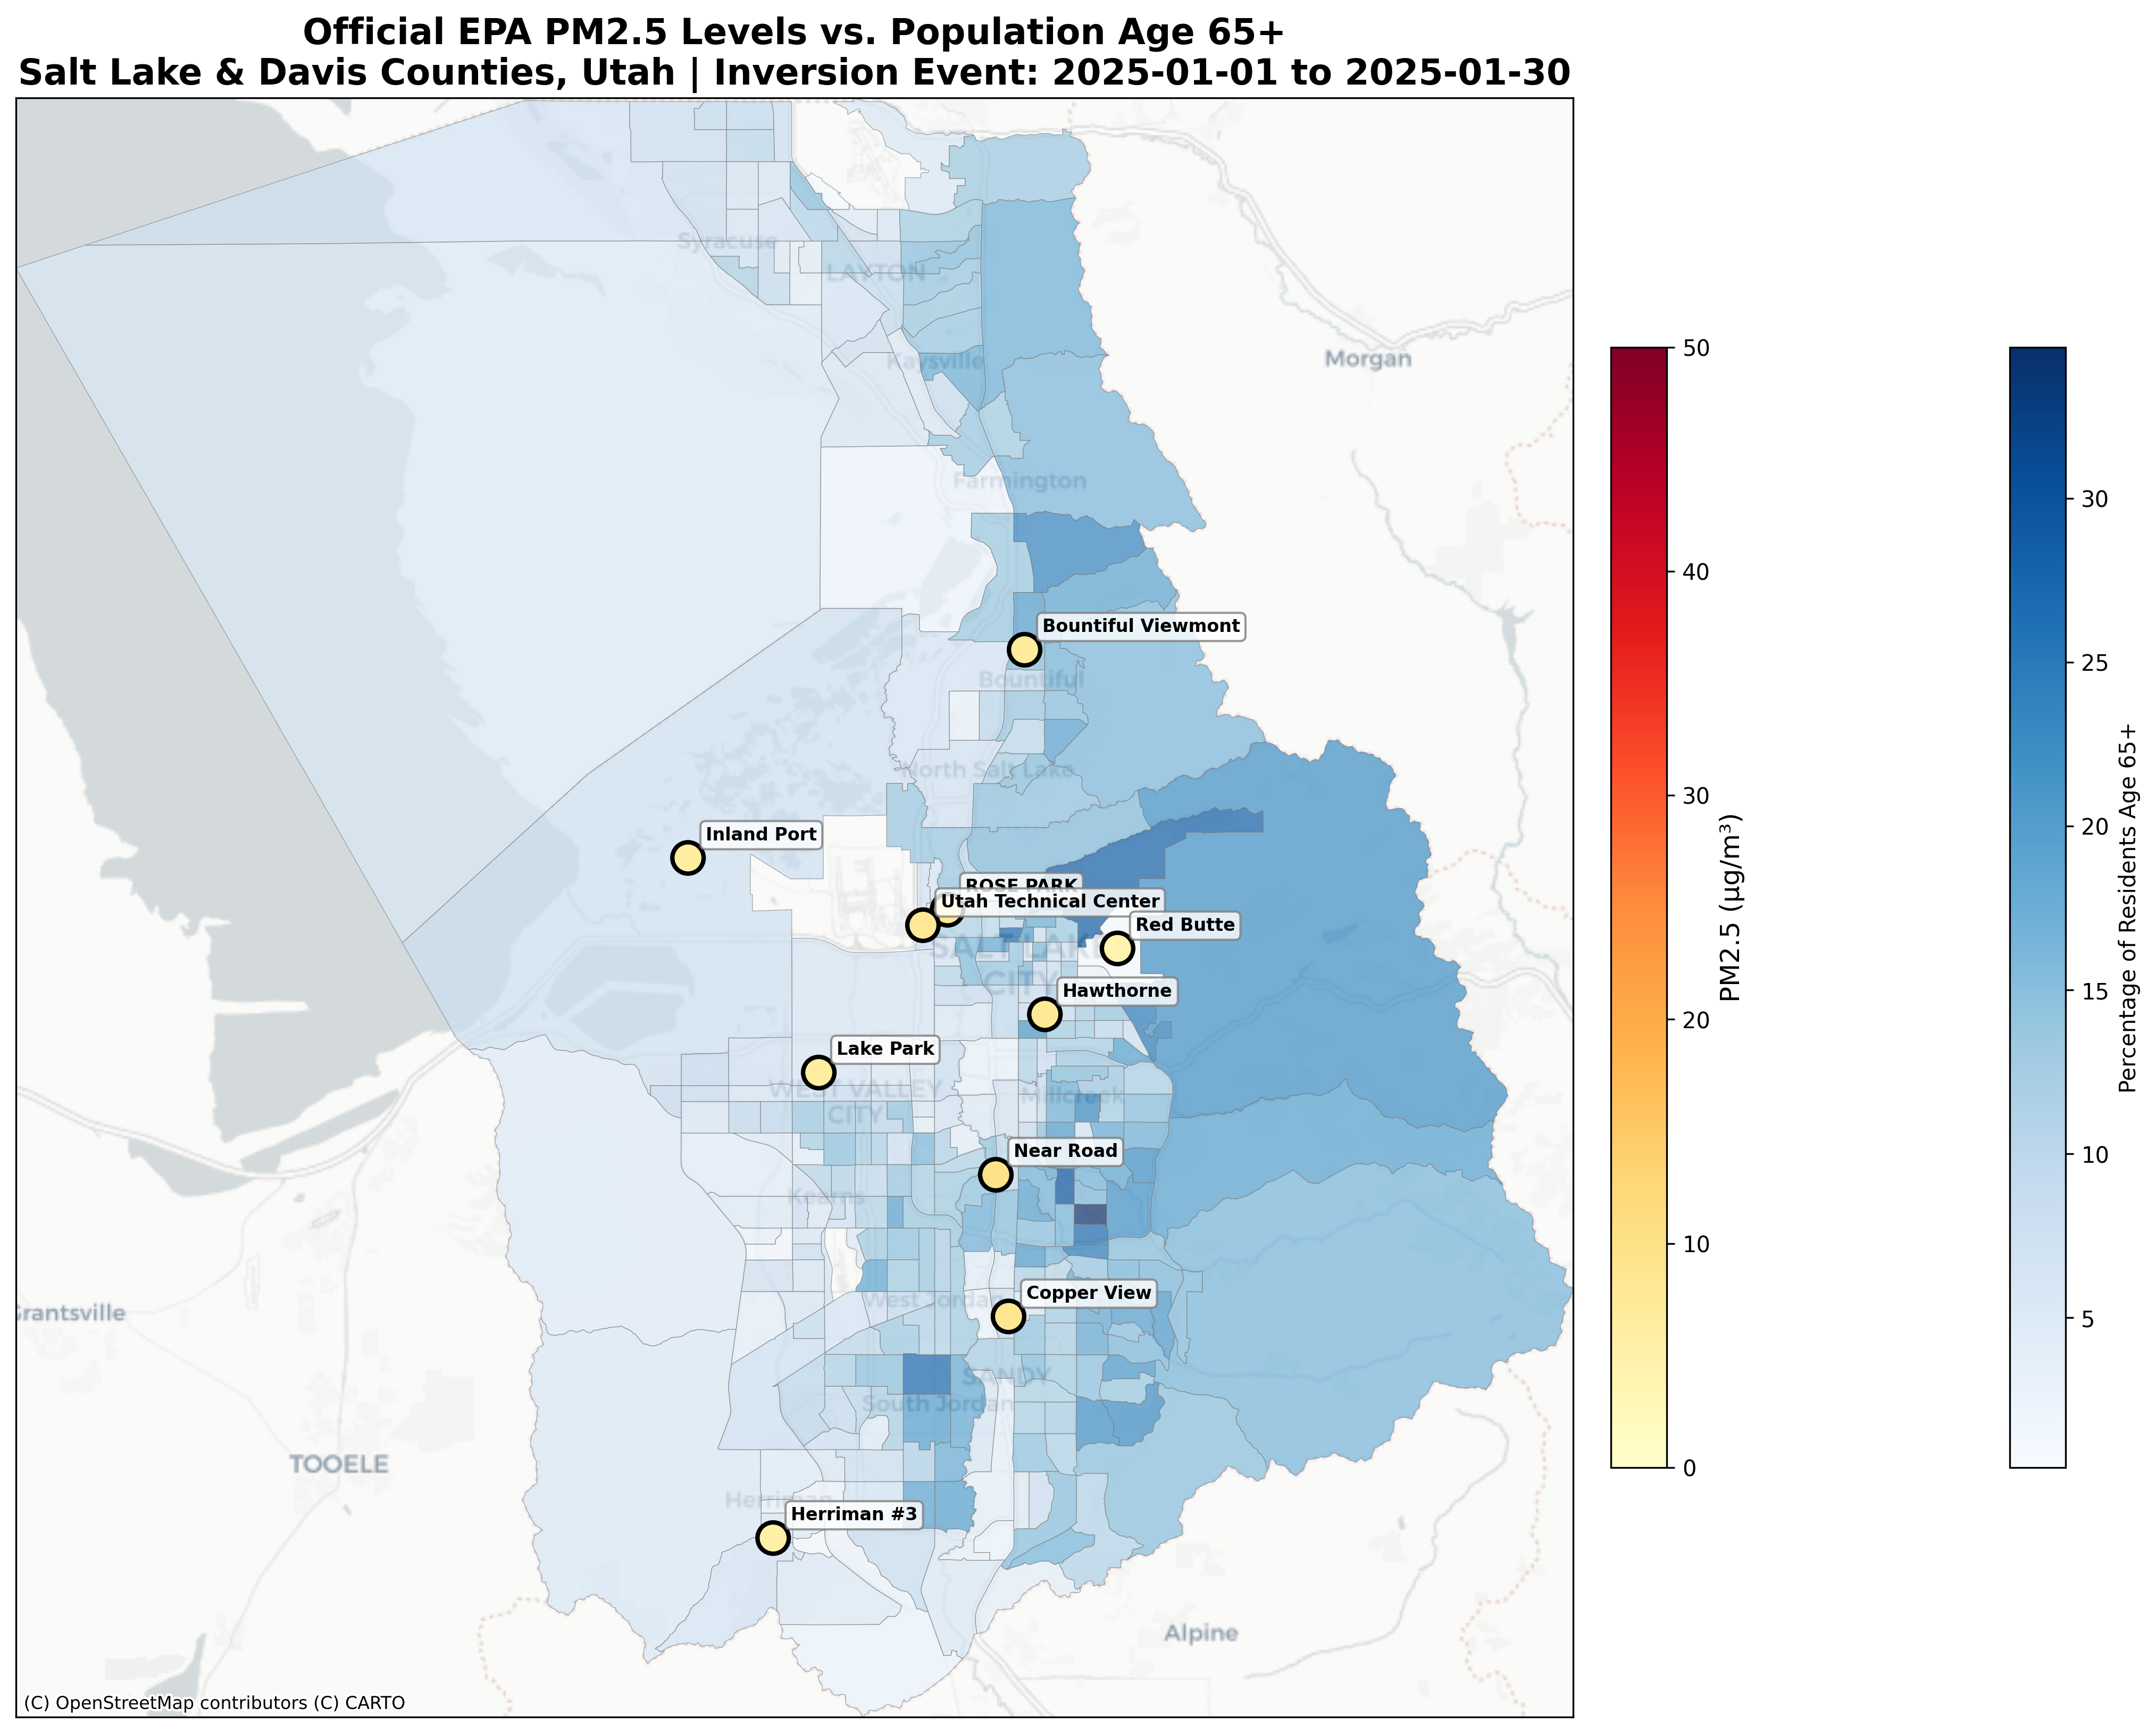
Population Age 65+ Map
Population Age 85+ Map
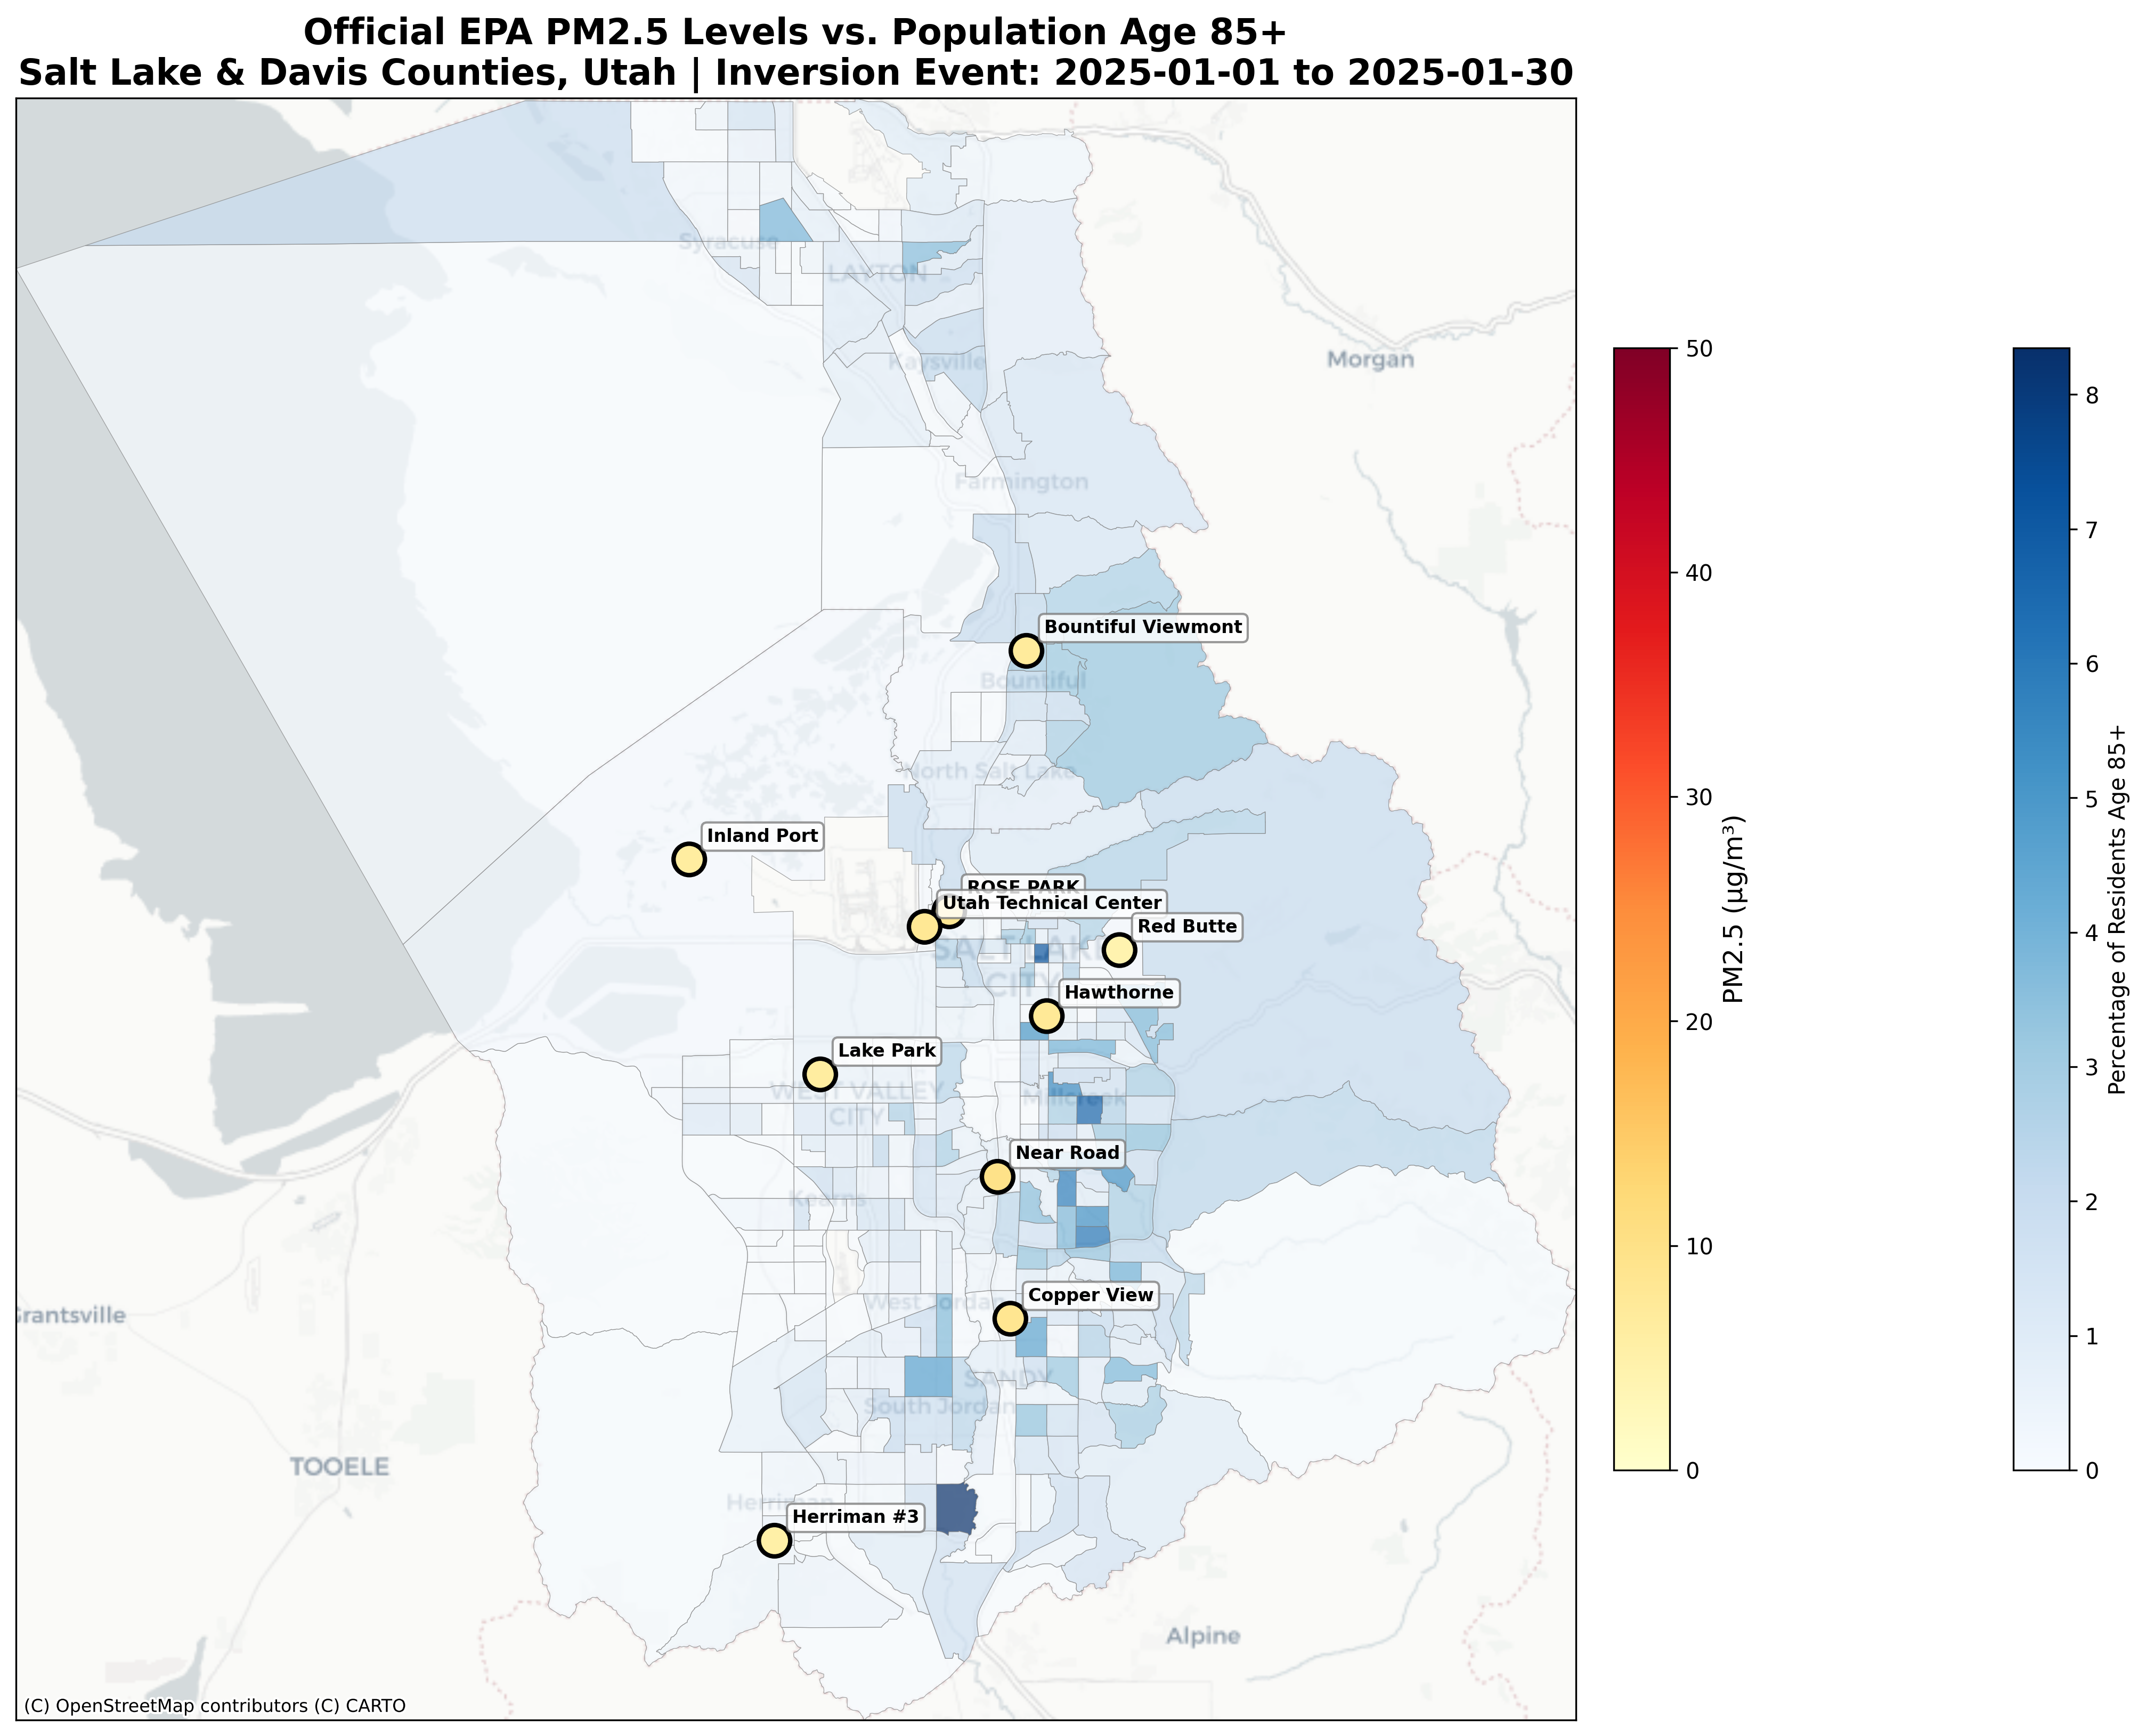
Layout (for each age group):
- Single Combined Map:
- Background Layer: Census tracts colored by population percentage (Blues colormap)
- Overlay Layer: EPA monitoring stations as large scatter points
- Color-coded by PM2.5 value (YlOrRd colormap)
- Black edges for visibility
- Labeled with station names
Purpose: Focus on official regulatory data with demographic context, using point-based visualization without interpolation assumptions. Separate maps allow comparison between 65+ and 85+ population distributions and their spatial correlation with PM2.5 exposure.
Data Analysis Plots
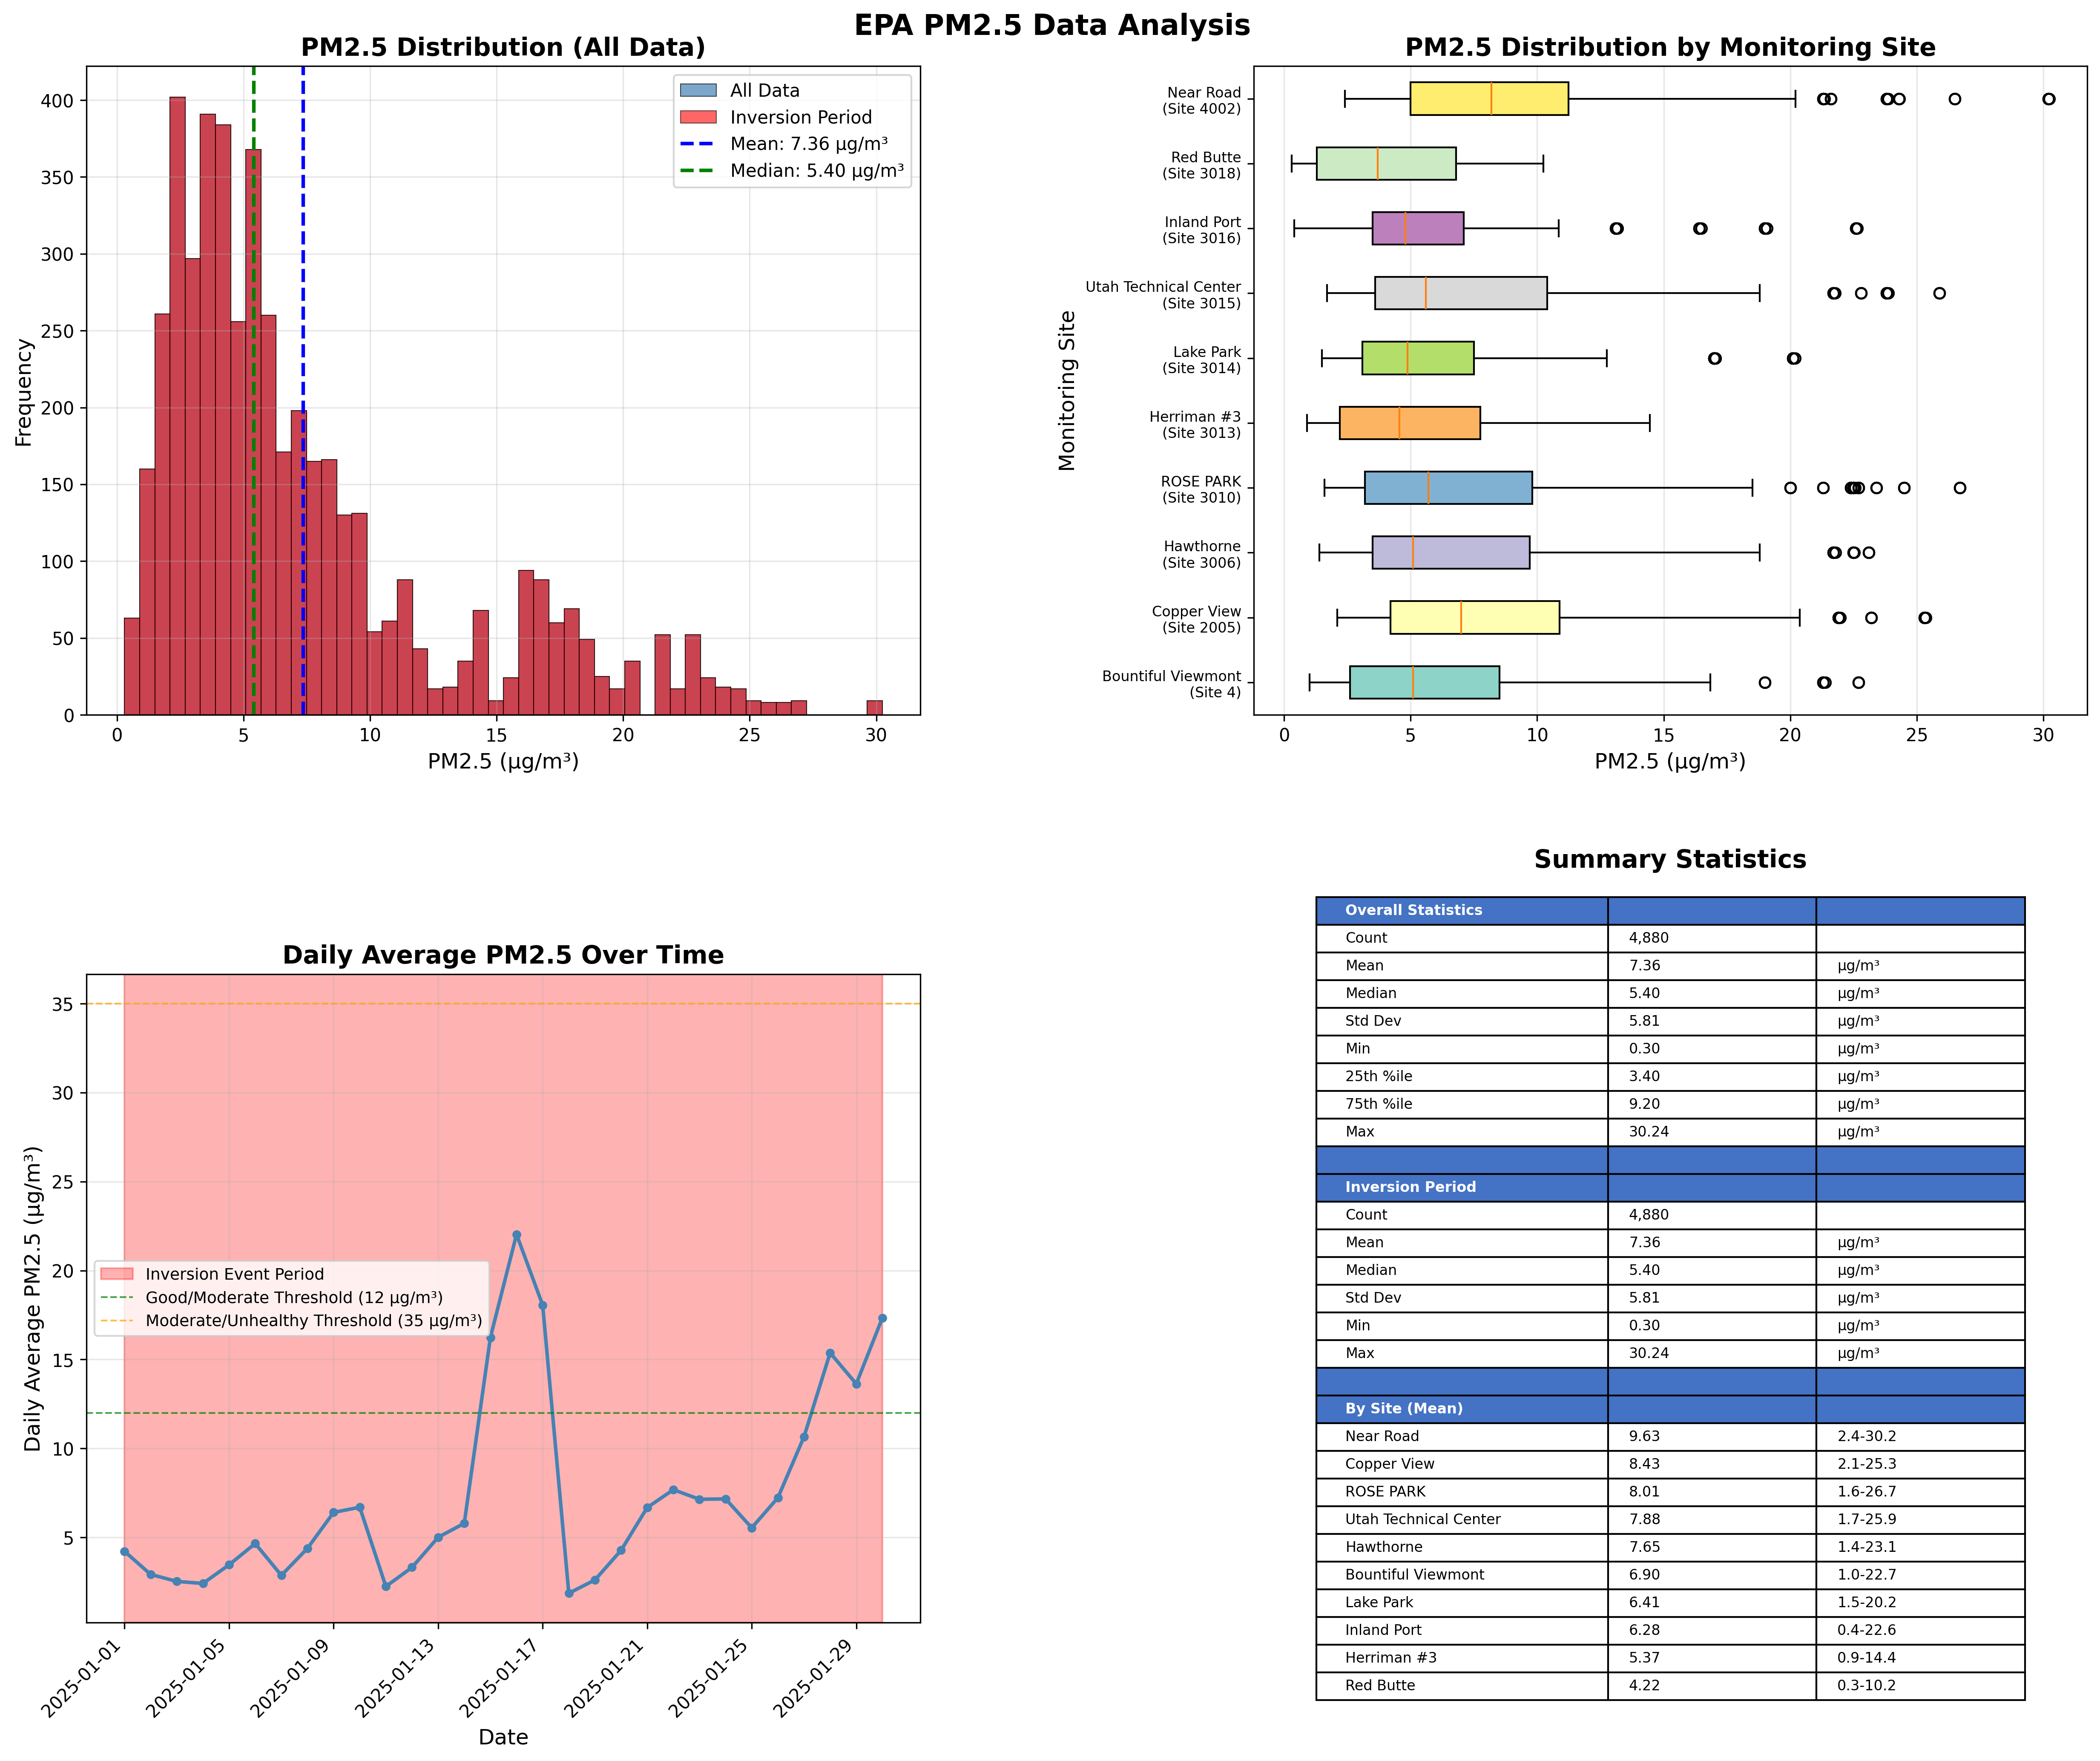
Content:
- Panel 1: PM2.5 Distribution Histogram (all data vs. inversion period)
- Panel 2: Box Plot by Monitoring Site (horizontal layout)
- Panel 3: Time Series (Daily Average PM2.5 Over Time)
- Panel 4: Summary Statistics Table
Interactive Web Maps
Population Age 65+ Map
Interactive map - Click and drag to explore, use controls to toggle layers
Population Age 85+ Map
Interactive map - Click and drag to explore, use controls to toggle layers
- Choropleth layer for population demographics (toggleable)
- Circle markers for EPA monitoring stations (color-coded by PM2.5 level)
- Hover tooltips showing census tract information
- Clickable popups with detailed station information
- Layer control panel for toggling visibility
- Legend with data period (January 1-30, 2025) and station counts
- Responsive design for desktop and mobile viewing
Key Findings
Air Quality Patterns
- Analysis Period: January 1-30, 2025
- Total Records: 4,880 measurements across 10 monitoring stations
- Mean PM2.5: 7.36 µg/m³
- Median PM2.5: 5.40 µg/m³
- Range: 0.30 - 30.24 µg/m³
- Standard Deviation: 5.81 µg/m³
Air Quality Status Distribution
- Good (<12 µg/m³): 4,022 records (82.4%)
- Moderate (12-35 µg/m³): 858 records (17.6%)
- Unhealthy (>35 µg/m³): 0 records (0.0%)
Site-Level Observations
- Red Butte (Site 3018): Lowest mean PM2.5 (4.22 µg/m³), consistent with elevated bench location
- Near Road (Site 4002): Highest mean PM2.5 (9.63 µg/m³), reflecting proximity to traffic emissions
- Spatial Variation: PM2.5 values range from 4.22 to 9.63 µg/m³ across sites, showing clear spatial heterogeneity
Preliminary Observations
- Regulatory-grade data provides reliable point measurements but limited spatial coverage
- Site-level differences suggest elevation and proximity to traffic sources influence PM2.5 concentrations
- Comparison of 65+ and 85+ population distributions reveals spatial patterns in vulnerable demographic exposure
- Further analysis needed to quantify correlation between elderly population density (both 65+ and 85+) and PM2.5 exposure at monitoring station locations
Descriptive Statistics
Analysis Period Statistics
- Analysis Period: January 1-30, 2025
- Records: 4,880 measurements
- Mean PM2.5: 7.36 µg/m³
- Median PM2.5: 5.40 µg/m³
- Standard Deviation: 5.81 µg/m³
- Range: 0.30 to 30.24 µg/m³
- 25th Percentile: 3.40 µg/m³
- 75th Percentile: 9.20 µg/m³
- AQI Category Breakdown:
- Good (<12 µg/m³): 4,022 records (82.4%)
- Moderate (12-35 µg/m³): 858 records (17.6%)
- Unhealthy (>35 µg/m³): 0 records (0.0%)
Overall Dataset Statistics (Full Year 2025)
- Total Records: 57,639 (January 1 - December 31, 2025)
- Monitoring Sites: 10
- Mean PM2.5: 6.65 µg/m³
- Median PM2.5: 5.80 µg/m³
- Standard Deviation: 4.16 µg/m³
- Range: -0.16 to 38.41 µg/m³
- 25th Percentile: 3.90 µg/m³
- 75th Percentile: 8.30 µg/m³
Site-Level Statistics (Analysis Period: January 1-30, 2025)
| Site Number | Site Name | Count | Mean (µg/m³) | Min (µg/m³) | Max (µg/m³) | Std Dev |
|---|---|---|---|---|---|---|
| 4 | Bountiful Viewmont | 478 | 6.90 | 1.0 | 22.70 | 5.68 |
| 2005 | Copper View | 510 | 8.43 | 2.1 | 25.35 | 5.87 |
| 3006 | Hawthorne | 772 | 7.65 | 1.4 | 23.10 | 5.79 |
| 3010 | ROSE PARK | 750 | 8.01 | 1.6 | 26.70 | 6.42 |
| 3013 | Herriman #3 | 540 | 5.37 | 0.9 | 14.45 | 3.79 |
| 3014 | Lake Park | 270 | 6.41 | 1.5 | 20.18 | 4.84 |
| 3015 | Utah Technical Center | 510 | 7.88 | 1.7 | 25.90 | 6.13 |
| 3016 | Inland Port | 270 | 6.28 | 0.4 | 22.64 | 5.25 |
| 3018 | Red Butte | 270 | 4.22 | 0.3 | 10.24 | 3.14 |
| 4002 | Near Road | 510 | 9.63 | 2.4 | 30.24 | 6.65 |
Note: Red Butte (Site 3018) shows the lowest mean PM2.5 (4.22 µg/m³), consistent with its elevated bench location. Near Road (Site 4002) shows the highest mean (9.63 µg/m³), reflecting proximity to traffic emissions.
Data Quality Metrics
- Data Completeness: 100% for all 10 monitoring sites during analysis period
- Temporal Coverage: Continuous daily measurements
- Outlier Detection: No values exceeded 500 µg/m³ (all values within physically reasonable range)
- Negative Values: 1 record with -0.16 µg/m³ (likely measurement artifact, represents <0.1% of data)
| ← Back to Home | View PurpleAir Analysis → |